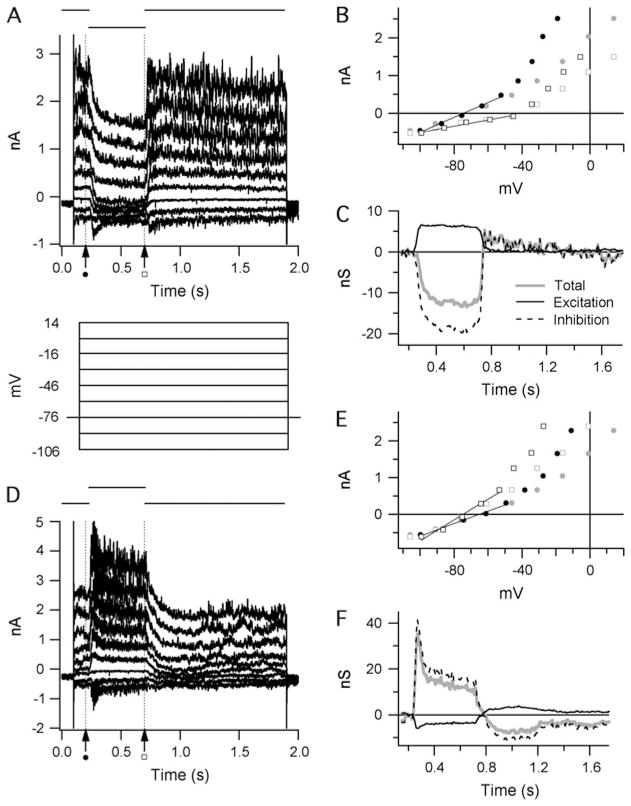
Fig. 1.
Calculating light-evoked changes in the synaptic conductance of A-type ganglion cells: (A and D) Current traces recorded from an OFF-S ganglion cell. A step change in light intensity of either negative contrast (A) or positive contrast (B) was presented over the receptive field center for 500 ms as indicated above the traces. Just prior to the light stimulus, the holding potential was stepped to a range of values, as shown below the current traces in panel (A). (B and E) Example IV graphs from the traces in (A) and (D) before (gray) and after (black) series resistance compensation. The positions at which example IV measurements were taken are indicated by the broken vertical lines in (A) and (D). Total membrane conductance was calculated by linear regression at negative holding potentials (fitted lines, B and E) to obviate nonlinearities associated with significant outward rectification at positive potentials. (C and F) Stimulus-evoked changes in synaptic conductance calculated from the traces in (A) and (D). The total membrane conductance (gray lines) is the sum of the calculated excitatory (solid black lines) and inhibitory (broken black lines) components.

