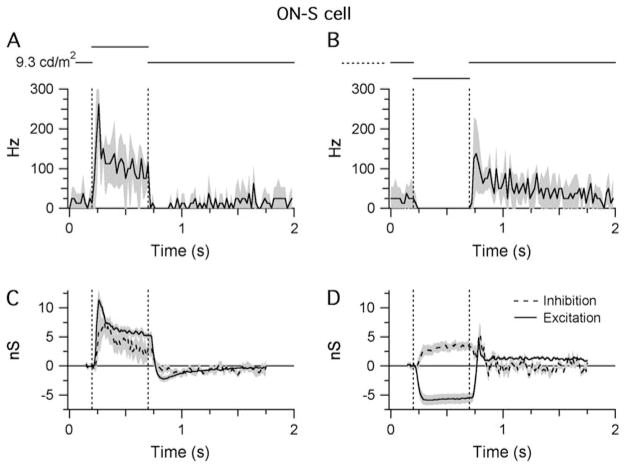
Fig. 3.
Light responses of ON-S cells. Shaded areas indicate ±1 S.E.M.: (A and B) STHs generated from extracellular responses recorded during RFC stimulation with either positive (A) or negative (B) contrast (±80%; background = 9.3 cd/m2 on the retinal surface). All traces show the average data collected from four cells. For each cell, the synaptic conductances were calculated from five stimulus presentations (see Materials and methods section). The bin width of the STHs is 20 ms. (C and D) Light-evoked changes in inhibitory and excitatory synaptic inputs in response to the same stimuli presented in (A) and (B). Responses were averaged from seven cells.

