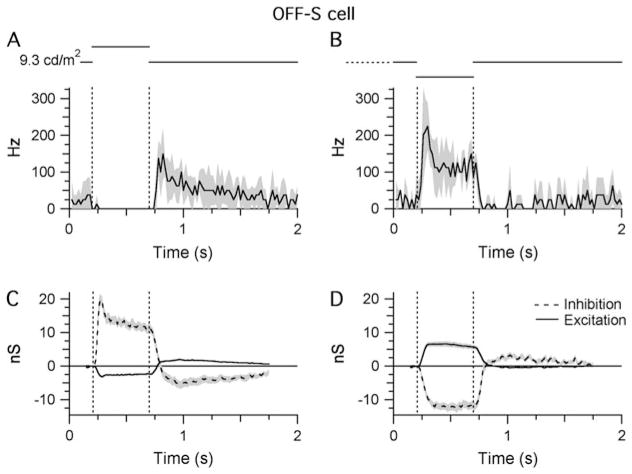
Fig. 4.
Light responses of OFF-S cells. Shaded areas indicate ±1 S.E.M. All traces show averaged data from 11 cells: (A and B) STHs generated from extracellular responses recorded during RFC stimulation with either positive (A) or negative (B) contrast (±80%; background = 9.3 cd/m2 on the retinal surface). The bin width of the STHs is 20 ms. (C and D) Light-evoked changes in inhibitory and excitatory synaptic inputs in response to the same stimuli presented in (A) and (B).

