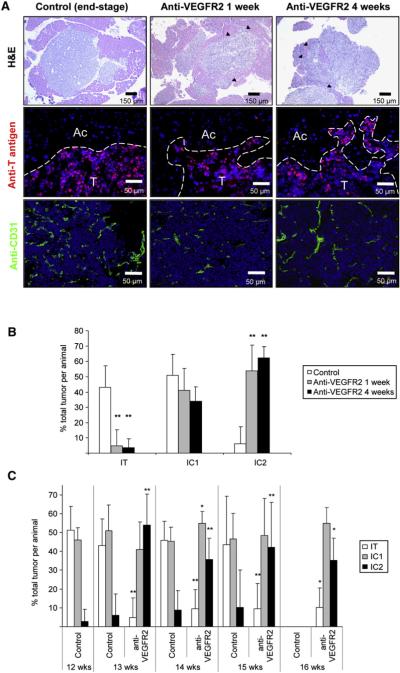
Figure 1. Increased Invasive Phenotype after Anti-VEGFR2 Therapy.
Histological analysis and quantification of tumor invasion in anti-VEGFR2 antibody (DC101)-treated or control immunocompromised tumor-bearing RIP1-Tag2 animals are presented.
(A) Histological images of tumors from control, 1-week, and 4-week treatment arms are shown in hematoxylin and eosin staining (H&E; top row), indicating prominent invasive fronts in the treated animals (black arrowheads); high-magnification images of immunofluorescence staining for SV40 T antigen (middle row), where T indicates tumor and Ac indicates surrounding acinar tissue; and immunodetection of the vasculature with anti-CD31 antibody (bottom row), where a central view of the tumor parenchyma is shown.
(B) Quantification of tumor invasiveness represented as the percentage of encapsulated islet tumors (IT), microinvasive carcinomas (IC1), and fully invasive carcinomas (IC2) for the three different treatments. Both anti-VEGFR2 treatments show a statistically significant decrease in the percentage of IT and a significant increase in IC2 tumors (**p < 0.01 by Kruskal-Wallis test).
(C) Quantification of tumor invasiveness in animals treated for only 1 week with anti-VEGFR2 antibody and then maintained without therapy for 1, 2, or 3 more weeks. Percentage of IT (white bars), IC1 (gray bars), and IC2 (black bars) is shown per treatment and time point. All treatment groups showed statistical differences by Mann-Whitney test (p < 0.01) when compared to the control group at the point when treatment was started. Age-matched treated versus control statistical analysis is shown for each time point. Note that no animals in the control group survived to the 16 week time point.
*p < 0.05, **p < 0.01 by Mann-Whitney test.
Error bars indicate ± SD.

