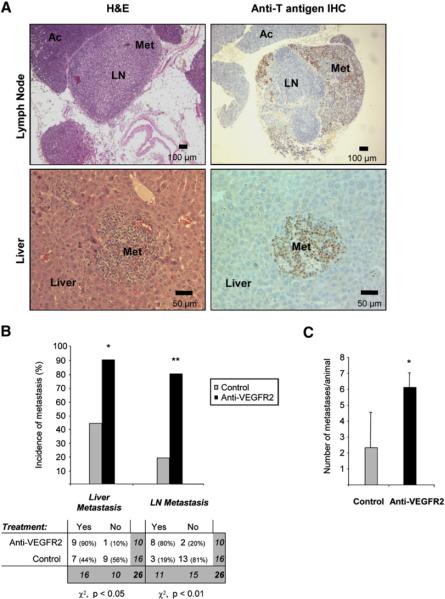
Figure 3. Increased Incidence of Lymph Node and Liver Metastasis in Anti-VEGFR2-Treated Animals.
Histological analysis of lymph node (LN) and liver metastasis (Met) in RIP1-Tag2 animals treated with anti-VEGFR2 for 10 days starting at 10 weeks of age and then left untreated until 16 weeks of age.
(A) LN and Met observed by histological H&E staining of tissue sections from anti-VEGFR2-treated animals appear as enlarged hemorrhaging LNs infiltrated with tumor cells and a small tumor nodule in the liver parenchyma (left panels). Immunohistochemical staining for the tumor marker SV40 T antigen (brown) reveals the presence of tumor cells infiltrated into a LN or in the midst of the liver parenchyma (right panels).
(B) Top: quantification of the incidence of animals with microscopic liver micrometastasis and macroscopic LN metastasis in the control (gray bars) and anti-VEGFR2-treated (black bars) treatment arms. Bottom: contingency table relating the number and percentage of animals in each treatment/metastasis case. Treated animals show a statistically significant increase in the incidence of liver micrometastasis and LN metastasis by the chi-square test (*p < 0.05; **p < 0.01).
(C) Quantification of the number of microscopic liver metastasis in the anti-VEGFR2 treated (black bars) and control (gray bars) treatment arms. Treated animals show a statistically significant increase in the number of liver micrometastases per animal by the Mann-Whitney test (*p < 0.05). Error bars indicate ± SEM.

