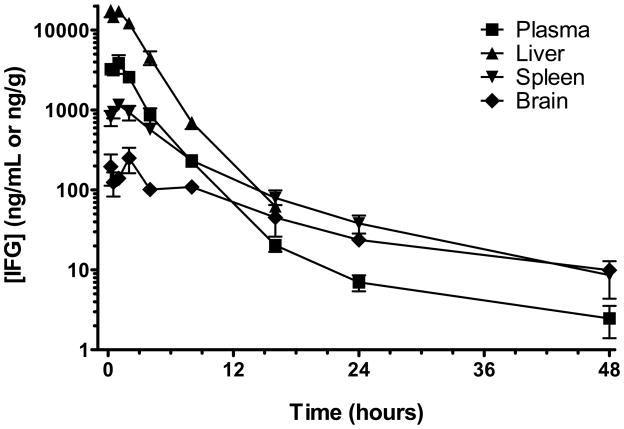
Figure 4. Tissue distribution pharmacokinetics of IFG.
Eight-week old male Sprague-Dawley rats were fasted overnight prior to administration of IFG tartrate (600 mg/kg, equivalent to 300 mg/kg free base) by oral gavage. Tissue and blood samples were drawn as a function of time. IFG levels were assessed by LC-MS/MS in plasma and tissue homogenates as described in ‘Materials and Methods’. Each point represents the mean±SEM from 3 rats.

