
Figure 1.
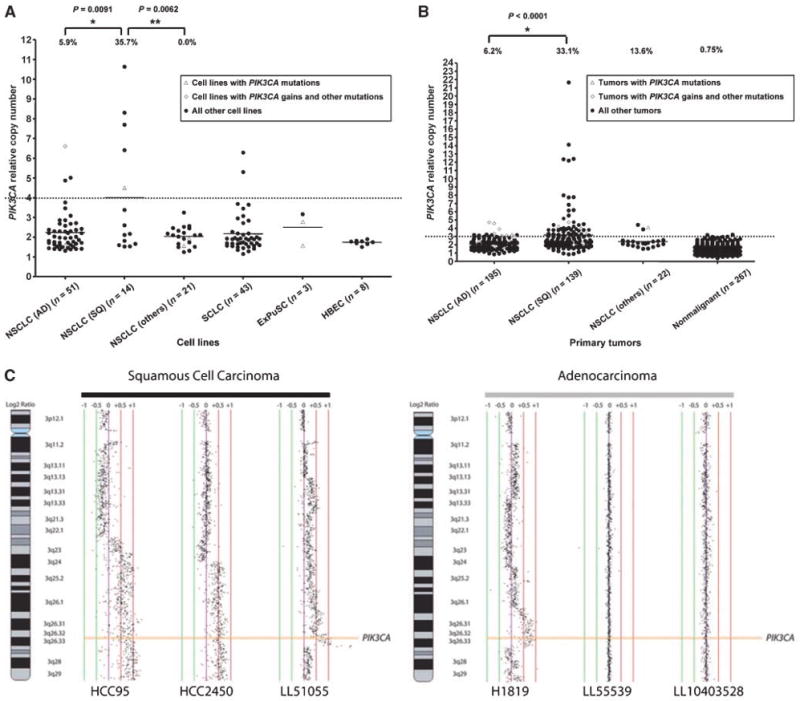
PIK3CA gene copy number in lung cancer cell lines (A) and primary tumors (B). Array CGH. Representative array CGH profiles at the PIK3CA gene locus for squamous cell carcinoma and adenocarcinoma (C). A and B, PIK3CA copy number was expressed as relative values compared with pooled human genomic DNA from multiple healthy donors. A, copy number in lung cancer cell lines. Open triangles indicate PIK3CA mutant cell lines, and open diamonds indicate PIK3CA copy number gain cell lines with mutations in other EGFR pathway genes. B, copy number in primary lung tumors. Corresponding adjacent nonmalignant tissues (n = 267) were also available. Copy numbers more than 4 (in cell lines) or 3 (in tumors) were considered as increased. We reduced the cutoff value to determine gains from 4 (for cell lines) to 3 for tumors to compensate for contamination with nonmalignant tissue in tumor samples (estimated average = 50% tumor cells, 50% nonmalignant cells). Fisher's exact test (cell lines) or χ2 test (primary tumors) were used to determine significance. C, normalized log2 signal intensity ratios were plotted using SeeGH software. Vertical lines denote log2 signal ratios from −1 to +1 with copy number increases to the right (red lines) and decreases to the left (green lines) of 0 (purple line). Each black dot represents a single bacterial artificial chromosome (BAC) clone. The region containing PIK3CA is shaded orange. For squamous cell carcinomas, two cell lines (HCC95 and HCC2450) displaying long segment PIK3CA gain/amplification and a clinical tumor specimen (LL51055) demonstrating focal amplification are depicted. For adenocarcinomas, one cell line, NCI-H1819 (H1819), with long segment high-level gain is depicted along with two clinical tumor specimens with diploid copy number for PIK3CA.