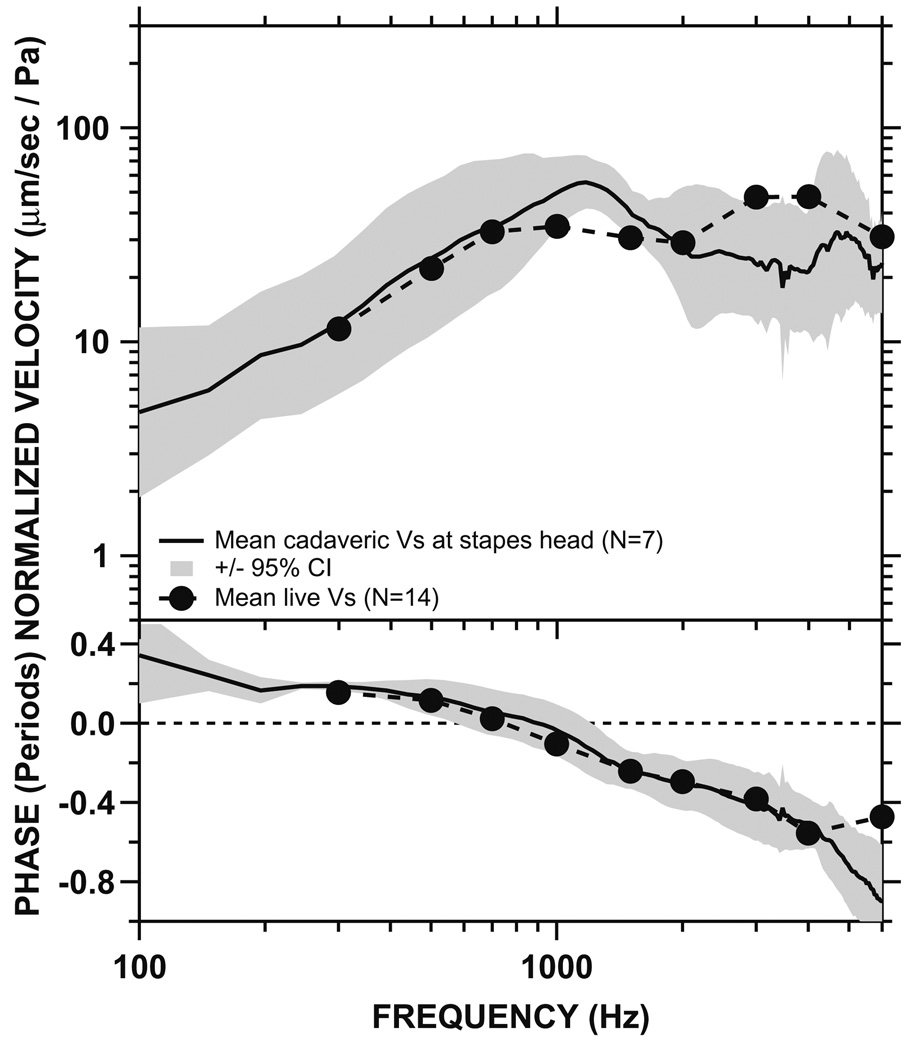
Fig. 9.
The mean and 95% CI of the Vs measured at the head of stapes in seven cadaveric temporal bones (solid black line and shaded areas), compared to the mean live stapes velocity in the present study (dashed line). Top panel: magnitude. Bottom panel: phase. There were no statistically significant differences between the live and cadaveric data (see also Table 1)

