
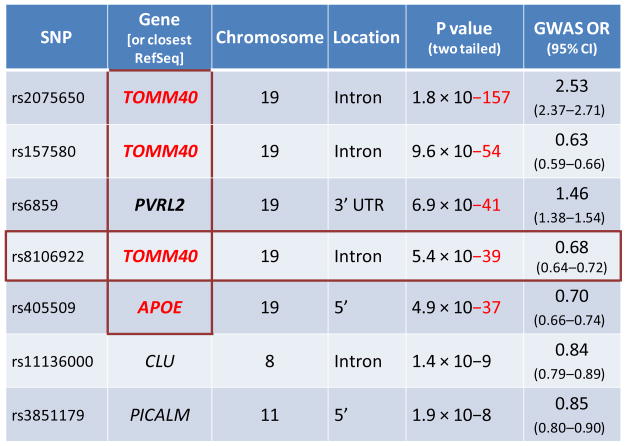
Table 1. Example of GWAS results for LOAD.
The genes in the vertical red box are within the APOE LD region. The SNP indicated in the horizontal red box is the SNP for which there is the best statistical support as a separator of the two clades on the phylogenetic tree for the TOMM40-APOE region (indicated in Figure 1). Modified from Harold et al. 2009 [2]).
 |