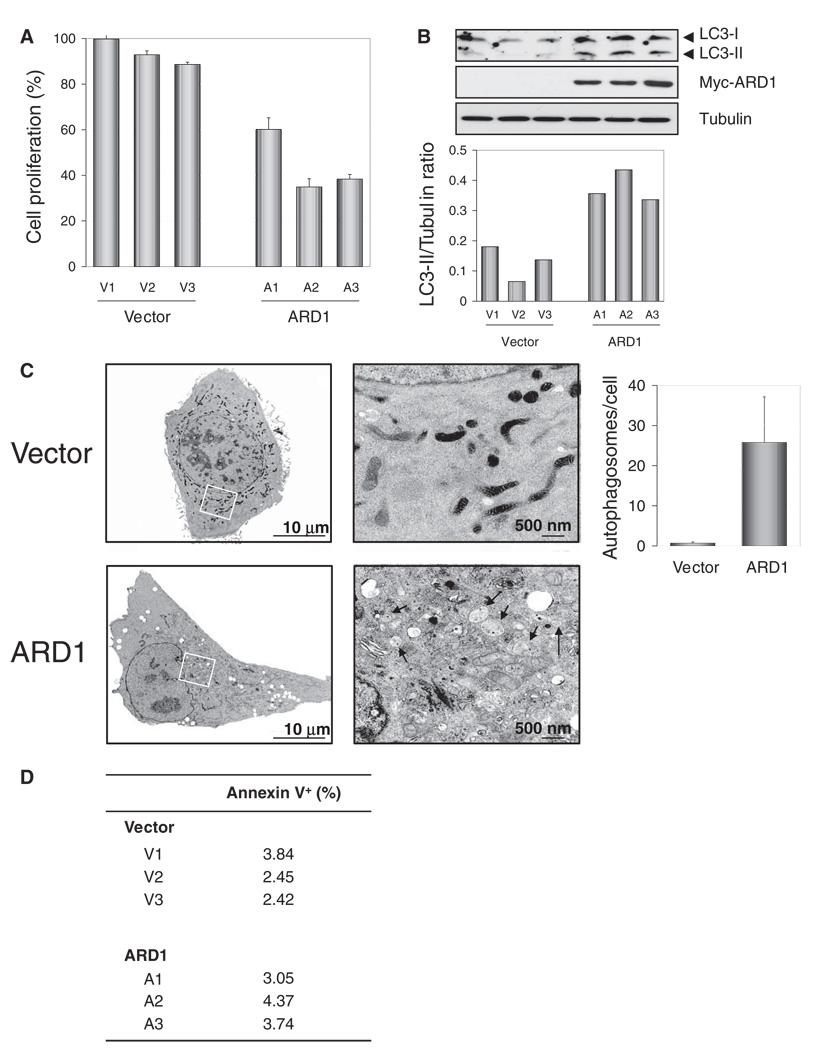
Fig. 3.
Suppression of cell proliferation and induction of autophagy by ARD1. (A) The cell proliferation rate, determined by BrdU incorporation, was decreased in ARD1 stable transfectants (P < 0.01; t test). Error bars represent SD (n = 3). (B) Increased conversion of LC3-I into LC3-II was found in ARD1 stable transfectants. (C) Transmission electron microscopy showed increased numbers of autophagosomes in ARD1 stable transfectants (P < 0.05; t test). Images on right represent rectangular areas in images on left. Arrowheads, autophagosomes. The number of autophagosomes per cell was assessed in 100 cells, and the results shown represent the mean ± 1 SD. (D) There was no significant difference in apoptotic cell population between the vector control and ARD1 stable transfectants (P = 0.248), which was determined by annexin V staining.

