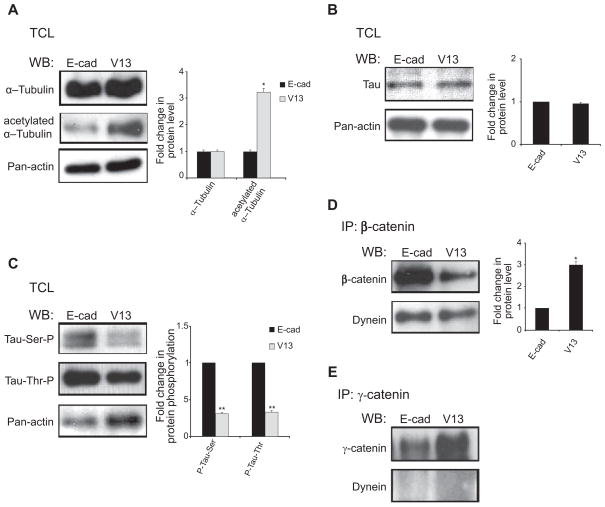
Figure 3.
N-glycosylation status of E-cadherin affects microtubule associated proteins (MAPs), tau and dynein. (A) effects of N-glycosylation of E-cadherin on α-tubulin expression and acetylation. WB of α-tubulin expression in total cell lysates (TCLs) from E-cad- and V13-transfected cells. While no significant difference in tubulin expression was detected, more acetylated α–tubulin was found in V13 cells. Bargraph, Fold changes in α-tubulin and its acetylated pool from V13 cells were determined in comparison to E-cad cells after normalization to actin (*P < 0.05). (B) effects of N-glycosylation of E-cadheirn on tau expression. WB of tau steady-state levels in TCLs from E-cad- and V13-transfected cells. No significant differences were detected between E-cad and V13 cells. (C) V13 cells have lower levels of phosphorylated tau. TCLs from E-cad and V13 cells were analyzed for ser199 and Thr231 phosphorylation of tau. Levels of P-tau were significantly lower in V13 compared to E-cad cells. Bargraph, Fold changes in P-tau levels in V13 cells were determined in comparison to E-cad cells after normalization to actin (**P < 0.01). (D) Recruitment of dynein to β-catenin complexes in E-cad and V13 cells. β-catenin immunoprecipitates from E-cad and V13 cells were assessed for association with dynein by WB. Bargraph, Fold change of dynein levels in γ-catenin immunoprecipitates from V13 cells was determined in comparison with E-cad cells after normalization to γ-catenin (*P < 0.05). (E) Association of dynein with γ-catenin complexes is not affected by N-glycosylation of E-cadherin. Bargraph Fold change in dynein levels in γ-catenin immunoprecipitates from V13 cells were determined in comparison with E-cad cells after normalization to γ-catenin. No significant differences were detected between E-cad and V13 cells. Error bars reflect standard deviation from at least three independent studies, and P-values were calculated by two-tailed t-test.

