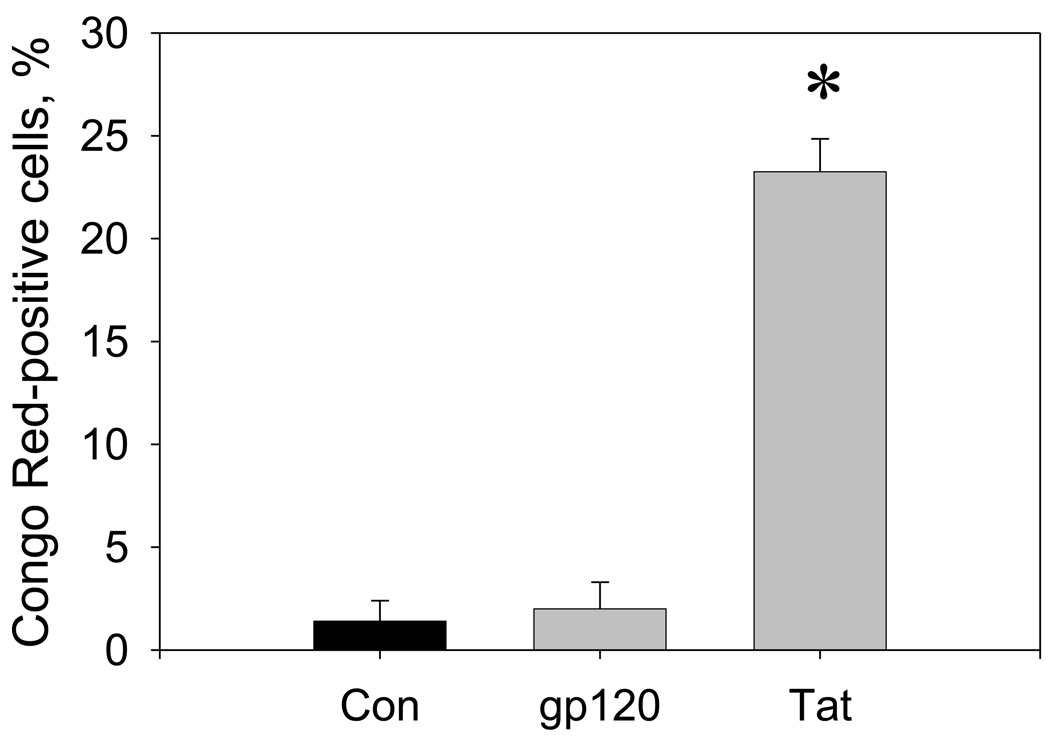
Figure 5. Changes in numbers of Congo Red-positive cells in hippocampal cell cultures exposed to HIV-1 Tat or gp120.
The graph represents relative numbers (% of total cells) of Congo Red-positive cells in hippocampal cell cultures after 3 days of treatment with vehicle (control), gp120 (100 nM), or Tat 1–86 B (100 nM). For each individual cell culture in a group (n=4), Congo Red-positive hippocampal cells were counted in 4 random fields of vision. For each field of vision (0.5×0.37 mm) results were normalized to the subsequent total cell number determined using Hoechst staining of cell nuclei (typically 70–95 cells per field). Data are presented as mean values ± SEM. *- marks significant (P<0.05) differences in relative numbers of Congo Red-positive cells.

