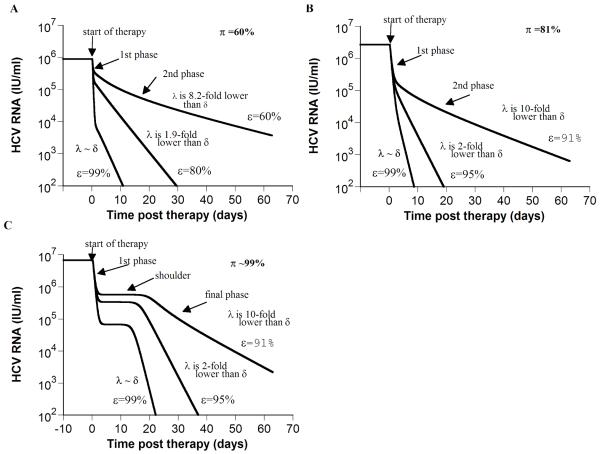
Figure 1. Model predictions of HCV RNA kinetics during successful treatment (ε >εc).
If the total drug efficacy, ε, is higher than the critical drug efficacy, εc, our model, which includes hepatocyte proliferation [5], predicts two HCV RNA kinetic patterns: biphasic (A and B) and triphasic (C). Using Eq. 3 and parameter values of each in-silico patient, we calculated the theoretical final viral decay slope, λ. In addition, we directly measured from the final phase the viral decline slope (λestimated) via linear regression of the kinetic data. When ε is low (i.e., 60% in (A) or 91% in (B and C)), λ ranged from 10-fold to 8-fold lower than δ, and λestimated = 0.06, 0.08 and 0.12 day−1, respectively. Whereas when ε =99% λ is close to δ, and λestimated = 0.46, 0.85 and 0.84 day−1 in A, B and C, respectively. Note the strong dependence of the final phase slope, λestimated, on effectiveness, ε,. e.g., in (B) λestimated increases from 0.08 day−1 to 0.85 day−1as ε increases from 91% to 99%. The calculated baseline percentage of hepatocytes that are HCV-infected, π (see Online Supplementary material), is 12%, 90% and 99% in (A), (B) and (C), respectively. Parameter values in (A) are Tmax = 7.3 × 10⁶ cells ml−1; dT = 3.5 × 10⁻³ day−1; δ = 0.47 day−1; β = 5.7 × 10⁻⁷ ml virions−1 day−1; c = 6.0 day−1; p = 1.5 virions cell−1 day−1; rT = 3.0 day−1; rI = 0.7 day−1; s = 1 cell day−1 ml−1;εc = 55%. With these parameter values T0 =7.3 × 10⁶ cells ml−1, T̄ =2.4 × 10⁶ cells ml−1, Ī =3.6 × 10⁶ cells ml−1, V̄ =5.95 log10 IU/ml. For both (B) and (C), Tmax = 9.8 × 10⁶ cells ml−1; dT = 1.34 × 10⁻² day−1; δ = 1.0 day−1; β = 8.3 × 10⁻⁷ ml virions−1 day−1; c = 2.4 day−1; p = 2.9 virions cell−1 day−1; rT = 3.0 day−1; s = 1 cell day−1 ml−1; εc = 89.9%, T0 =9.8 × 10⁶ cells ml−1. As previously explained [5], if we increase the infected cell replication rate – here from rI = 0.7 day−1 (used in (B)) to rI = 2.3 day−1 - a shoulder phase emerges in (C). In (B) and (C), T̄ =4.9 × 10⁵ and 0.23 cells ml−1, Ī = 2.2 × 10⁶ and 5.6 × 10⁶ cells ml−1, V̄ = 6.4 and 6.8 log10 IU/ml, respectively.

