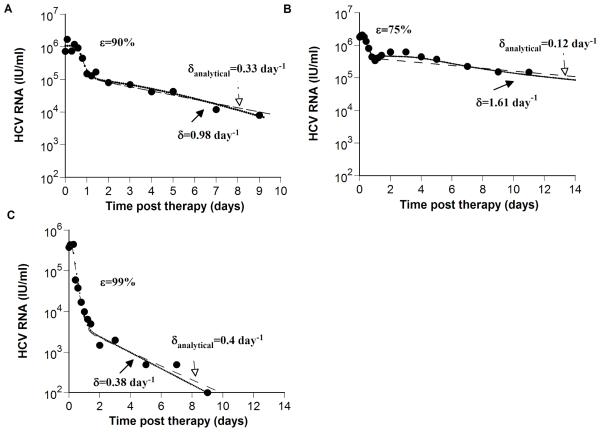
Figure 2. Comparison of estimates of δ obtained from models with and without hepatocyte proliferation.
To show that previous estimates of the HCV-infected cell loss rate, δanalytical, obtained using the Neumann et al. model that does not include hepatocyte proliferation [6], may underestimate δ we examined experimental data (●) of three patients from Neumann et al [6]: (A) patient 3F, (B) patient 1B, and (C) patient 3D. The analytical solution for V(t), i.e., Eq. (4) in Neumann et al. [6], is plotted (dashed lines) using the values given in Table 1 of Neumann et al. [6], for the delay time before viral decay begins, t0, the interferon-α effectiveness, ε, the viral clearance rate constant, c, and the infected loss rate constant, δanalytical. Then, we fitted our model (Eq. 1; dotted lines) to the same HCV RNA data (●) with t0, ε, and c held fixed at the values estimated by Neumann et al. [6], i.e., for (A), (B) and (C), respectively c = 5.8, 6.4 and 6.0 day−1; t0 = 0.58, 0.33 and 0.21 days, and ε = 0.90, 0.75 and 0.99. In addition, we set Tmax = 7.5 × 10⁶ ml−1; dT = 3.5 × 10⁻³ day−1, s=1 cell ml−1 day−1 and rT = 3.0 day−1 for all patients and found the best-fit values and corresponding confidence intervals for the parameters p, rI, β and δ for each patient as explained in Methods. The baseline percentage of hepatocytes that are HCV-infected, π, (see Online Supplementary Material), was estimated as 91%, 99% and 6% in (A), (B) and (C), respectively. Parameter values estimated in (A), (B) and (C), are shown in Table 1. It should be noted that using the F-test or Akaike’s information criterion to compare the fitting results of the analytical model and the extended model with additional parameters describing proliferation we found that there is no statistical support for the extended model (not shown).

