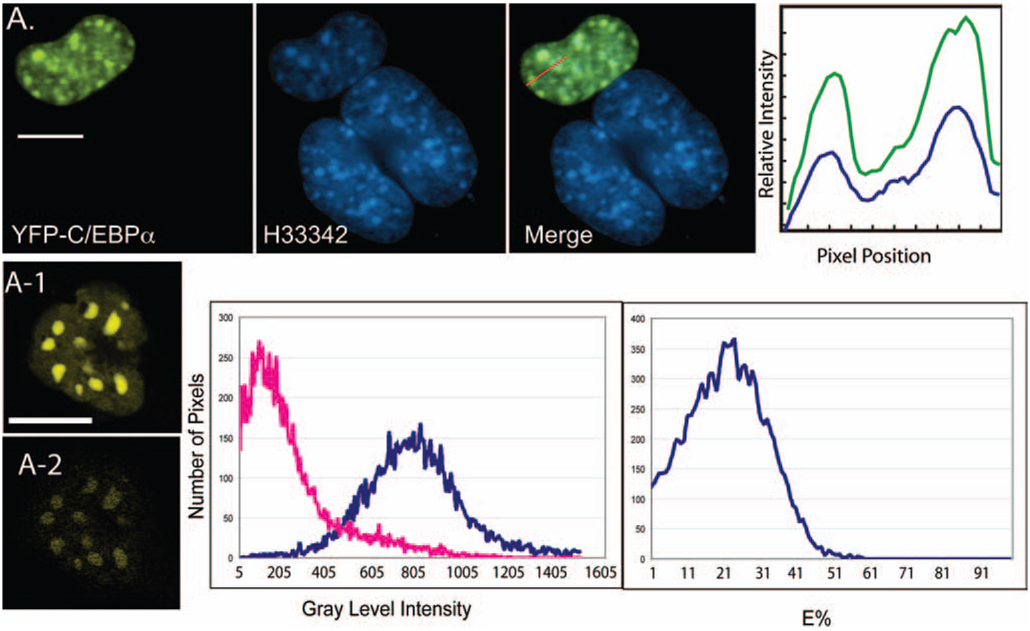
Fig. 6.
Measurement of C/EBPα protein dimerization in GHFT1 cells. The psFRET algorithm helps to identify the protein dimerization (A-2) involving the basic region–lucine zipper (B-zip) transcription factor C/EBPα. The upper panel shows the expression of YFP with C/EBPα and its accumulation in the region of centromeric heterochromatin stained by the DNA dye H33342 [The upper panel images were acquired using the arc lamp, filter-based wide-field microscope system as described in the literature (Day et al., 2003)]. A-1 is sFRET contaminated with ASBT. Histogram before (blue colour) and after (red colour) ASBT removal. Histogram of E% distribution from this cell is also shown. (scale bar: 10 µm)

