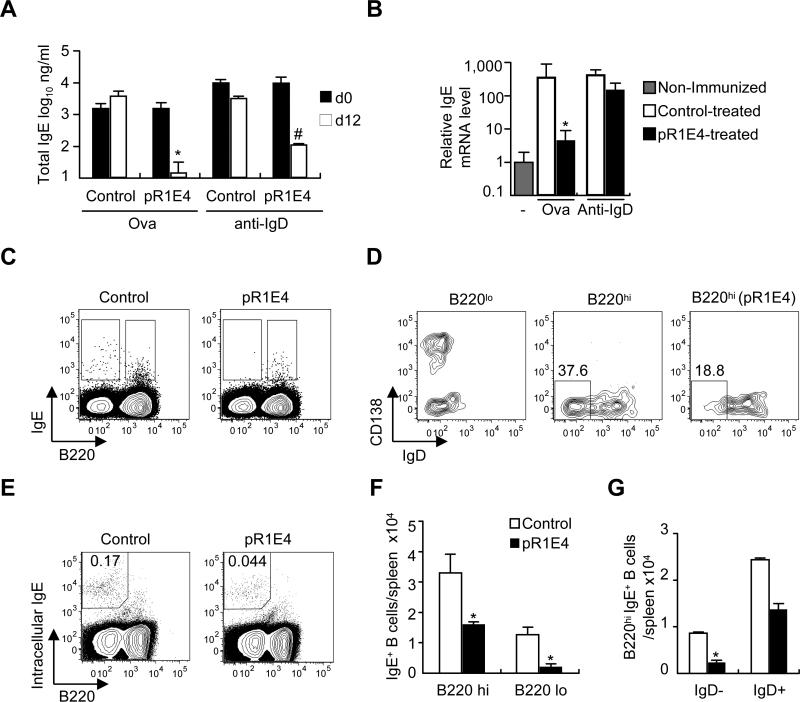
Figure 3.
Effects of pR1E4 plasmid treatment on ongoing IgE responses induced by ovalbumin/alum immunization or goat-anti mouse IgD treatment. Two-month old BALB/c mice injected i.p. ten days previously (day -10) with either 10μg ova/alum or 200μl goat anti-mouse IgD serum were treated with control or pR1E4 plasmids i.v. on d0 and analyzed on d0 and d12 for suppression of the IgE response. (A) Total serum IgE levels on d0 (filled bars) and d12 (open bars). (B) Splenic IgE H-chain mRNA levels assessed by qPCR. (C-G) Flow cytometry analysis of IgE+ B cells in spleens of mice injected with anti-IgD and subsequently treated with control or pR1E4 plasmid. (C) Analysis of the frequencies of B220hi and B220loIgE+ B cells among CD4-CD8-c-kit-CD49b- gated viable spleen cells. (D) Comparison of CD138 and IgD expression of B220lo and B220hi populations in control plasmid and pR1E4-treated mice, as gated in C. Left, B220lo cells from control plasmid-treated mouse; center panel, B220hi cells from control plasmid-treated mouse; right, B220hi cells of pR1E4-treated mouse. (E) Analysis of treated and control anti-IgD-injected mice for the presence of cells that expressed high levels of intracellular IgE. (F) Summary of pR1E4-induced reductions in IgE+B220hi and IgE+B220lo subsets using the analysis in C. (G) Quantitation of pR1E4-induced reduction in surface B220hiIgE+IgD- B cells, as in D. Significance calculated using Student's T test. *P < .01, #P < .05. n= 4-6 mice/group.

