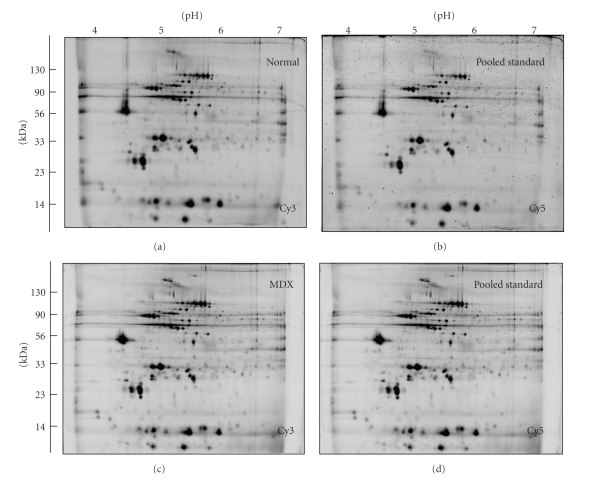
Figure 1.
2D gel electrophoretic analysis of the dystrophic heart using the pH 4–7 range. Shown are Cy3-labelled gels of the soluble fraction from normal (a) and dystrophic MDX (c) cardiac muscle, as well as Cy5-labelled gels containing pooled standards ((b), (d)). Representative fluorescent DIGE gels with electrophoretically separated proteins are shown for the pH 4–7 range. The pH-values of the first dimension gel system and molecular mass standards (in kDa) of the second dimension are indicated on the top and on the left of the panels, respectively.

