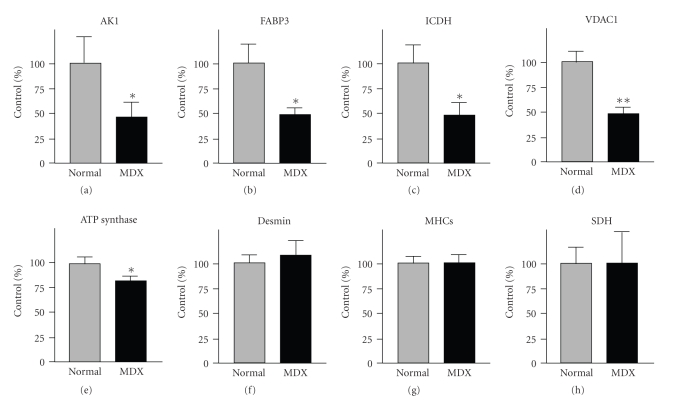
Figure 6.
Graphical presentation of the immunoblot analysis of cardiac marker proteins in dystrophic tissue. Shown is the graphical presentation of the statistical evaluation of immuno-decoration using antibodies to adenylate kinase isoform AK1 (a), fatty acid binding protein FABP3 (b), isocitrate dehydrogenase ICDH (c), porin isoform VDAC1 (d), ATP synthase (e), desmin (f), slow/cardiac myosin heavy chain MHCs (G) and succinate dehydrogenase SDH (H). The comparative blotting was statistically evaluated using an unpaired Student's t-test (n = 5; *P < .05; **P < .01). The concentration of desmin, myosin heavy chain and succinate dehydrogenase was found not to be significantly different between normal and dystrophic preparations. Lanes 1 and 2 represent normal and dystrophic muscle extracts from control and MDX mice, respectively.

