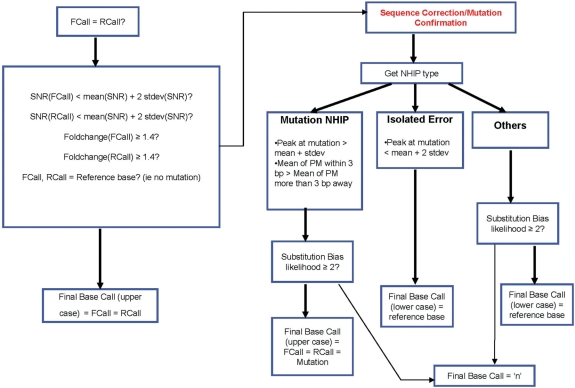
Figure 1.
FlowChart of EvolSTAR. FlowChart of EvolSTAR. Bold arrows are ‘Yes’ paths, while normal arrows are ‘No’ paths. In the first step, each base query is scrutinized for signs of hybridization intensity abnormalities. Base queries with hybridization intensity abnormalities are passed to step 2 for further analysis.

