Figure 1.
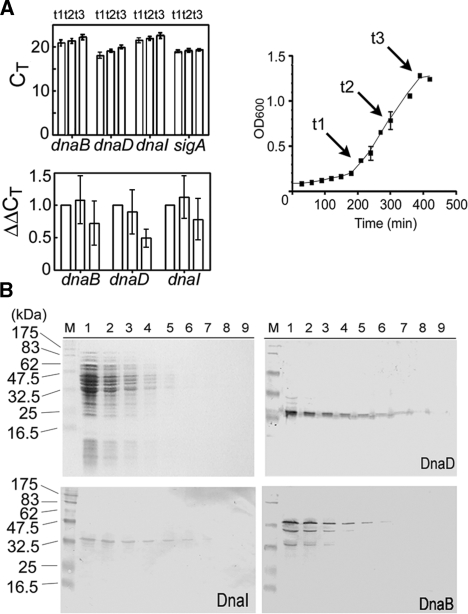
Growth-dependent expression of dnaD, dnaI and dnaB genes. (A) Growth curve of B. subtilis strain 168 in LB at 30°C over time. Time points t1, t2 and t3 when samples were analysed are indicated. The top bar graph shows levels of dnaB, dnaD, dnaI and sigA as CT values from RT-PCR over time. The bottom bar graph shows changes in gene expression calculated from the formula 2−ΔΔCt for dnaB, dnaD and dnaI, using sigA as control and t1 as calibrator, over time. In both graphs each bar represents the mean of five independent experiments. The error bars indicate standard deviations. (B) Western blot analysis of B. subtilis soluble extracts from overnight cultures. A typical SDS–PAGE gel with decreasing amounts of extracts (72, 36, 18, 9, 4.5, 2.2, 1.1, 0.5 and 0.25 μg) is shown (top left), with western blots for DnaD, DnaI and DnaB, as indicated. DnaB is truncated to smaller versions. Pre-stained molecular weight markers from New England Biolabs are indicated in kDa.

