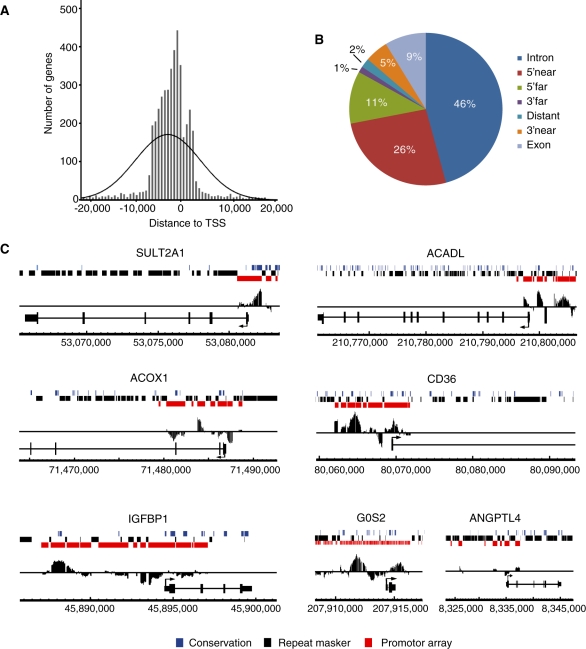
Figure 1.
Mapping of PPARα binding regions enriched upon GW7647 treatment. (A) Positional distribution of all identified PPARα binding regions relative to TSSs of the nearest gene. (B) Identification of the genomic location of PPARα binding regions using PinkThing. The following classification criteria were used: distant (>25 kb), 5′ far (25–5 kb), 5′ near (5–0 kb), intron (intronic), exon (exonic), 3′ near (0–5 kb) and 3′ far (5–15 kb). (C) Enrichment of promoter regions in PPARα target genes. Enriched ChIP-chip signals were visualized using Affymetrix integrated genome browser. Coverage of promoter tiling array is indicated in red, repetitive sequences in black, and conserved sequence in blue. PPARα target genes SULT2A1, ACOX1, IGFBP1, ACADL, CD36 and G0S2 all show positive enrichment within promoter regions. No enrichment is observed in the promoter of ANGPTL4 as the known PPRE is present within the (non-covered) intron 3.

