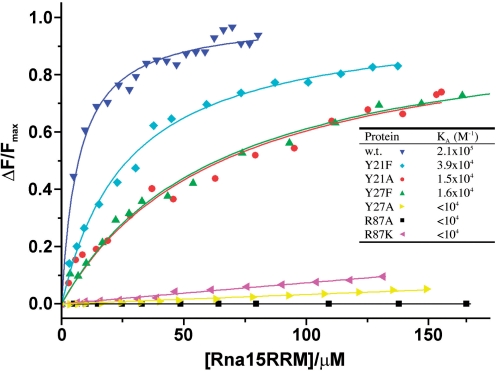
Figure 5.
Examination of the binding affinity of U/G-pocket mutants by fluorescence spectroscopy. The panel shows the titration curves [fraction of bound RNA; ΔF/Fmax versus total Rna15(16-111) concentration] derived from the change in fluorescence intensity for Rna15(16-111) (dark blue) and substitution mutants Y21F, Y21A, Y27F, Y27A, R87A and R87K upon binding to the Tet-UGUUGU ribo-oligonucleotide. The Binding constants in the inset table were determined from these plots by fitting of a hyperbolic binding isotherm to the data.

