Figure 6.
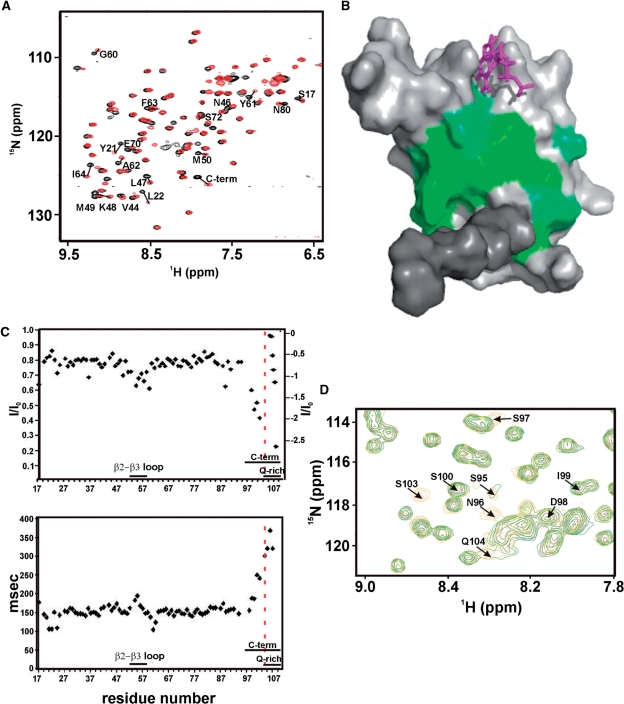
Conformation of the C-terminal region. (A) Superimposition of the 15N-1H HSQC spectra of RNA15(16-111) (black) and RNA15(1-94)-ht (red). The core domain, residues 16-94, that have a Δδ > 0.06 between the RNA15(16-111) and RNA15(1-94)-ht constructs are labelled. (B) Residues that display significant chemical shift changes (Δδ > 0.06) are plotted on a surface representation of the domain, green. The C-terminal region is shown in dark grey and a G nucleotide bound at Site-I is shown in magenta. (C) Heteronuclear NOEs (top) and 15N T2 (bottom) of the Rna15(16-111) backbone resonances plotted against the domain sequence. Unassigned resonances from Q104-Q109 are inset on the top panel and are ordered by decreasing value of the heteronuclear NOEs, reported on the scale on the right. Fast motions are visible in the β2-β3 loop and in residues 98–103. (D) Superimposition of the 15N-1H HSQC spectra of RNA15(16-111) at pH 7.4 (black), 6.8 (green) and 6.0 (orange) (blow-up). Resonances of residues C-terminal to 94 are labelled. G101 and V102 amide correlations are outside the region shown.

