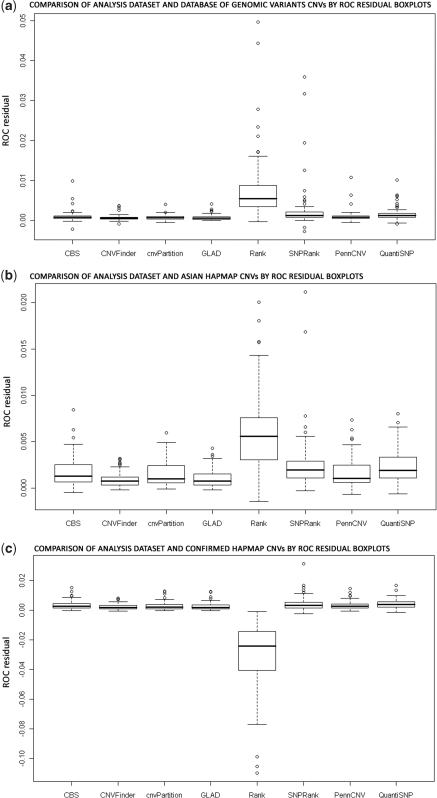
Figure 2.
Boxplots for ROC curve residual from comparison of CNVs in the analysis dataset and three CNV databases. (a) CNVs from SNP studies in the Database of Genomic Variants were used to compute sensitivity and 1-specificity. (b) CNVs from Asian samples in HapMap from Redon et al. (11) were used. (c) Experimentally confirmed CNVs in all HapMap samples from Redon et al. (11) were used.

