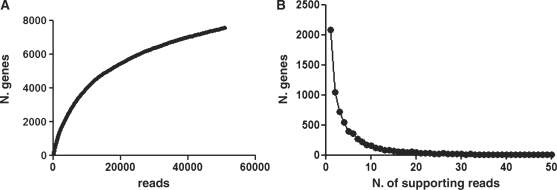
Figure 2.
(A) Rank abundance curve obtained by plotting the total number of mapped informative reads (presence of both 454 primers) versus the total number of identified genes. (B) Chart shows how many genes are supported by different number of reads. As a result of cDNA normalization the vast majority of genes are represented by up to 10 reads while only very few genes show more reads (with a maximum of 680). X-axis has been limited to 50.

