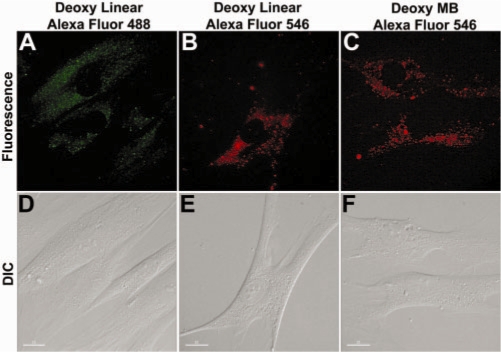
Figure 5.
Signal distribution of Alexa Fluor-labeled oligonucleotide probes, as indicated by fluorescence (A–C) and DIC (D–F) images of HDF cells 24 h after delivery of probes, including random-sequence linear oligonucleotide probes labeled with Alexa Fluor 488 (A and D) and Alexa Fluor 546 (B and E) respectively, and random-sequence MBs labeled with Alexa Fluor 546 (C and F). Alexa Fluor labeled probes showed perinuclear localization instead of mitochondria accumulation. Scale bar = 15 µm.

