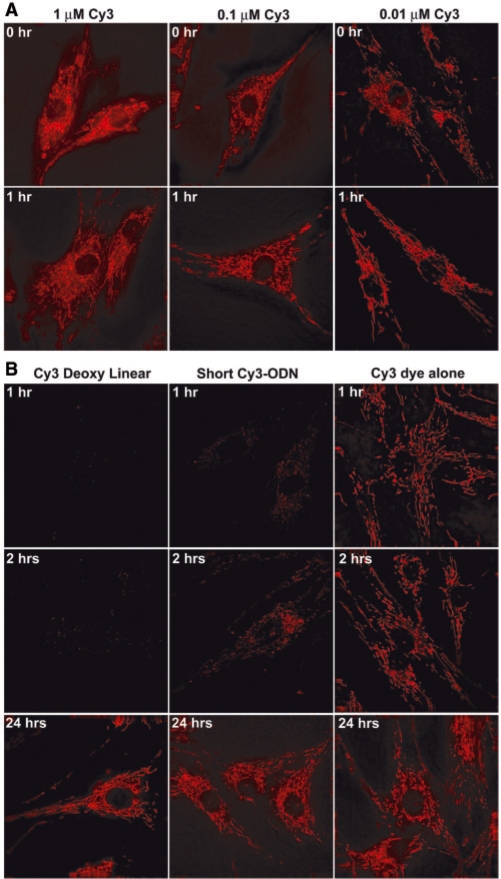
Figure 6.
Accumulation of Cy3 dye and Cy3-labeled short-linear oligonucleotide at mitochondria. (A) Fluorescence images of Cy3 dye emission at 0 h (right after delivery) and 1 h after delivery with 1 µM (exposure time: 5 ms), 0.1 µM (exposure time: 50 ms) and 0.01 µM (exposure time: 200 ms) Cy3 concentration. (B) Comparison of fluorescence images of Cy3-labeled random-sequence linear ODN probe (right panel), Cy3-labeled short ODN probe (middle panel) and Cy3 dye alone at 1, 2 and 24 h after delivery, all with concentration of 1 µM. The exposure time for the ODN probes was 200 ms, and that for Cy3 dye was 5 ms.

