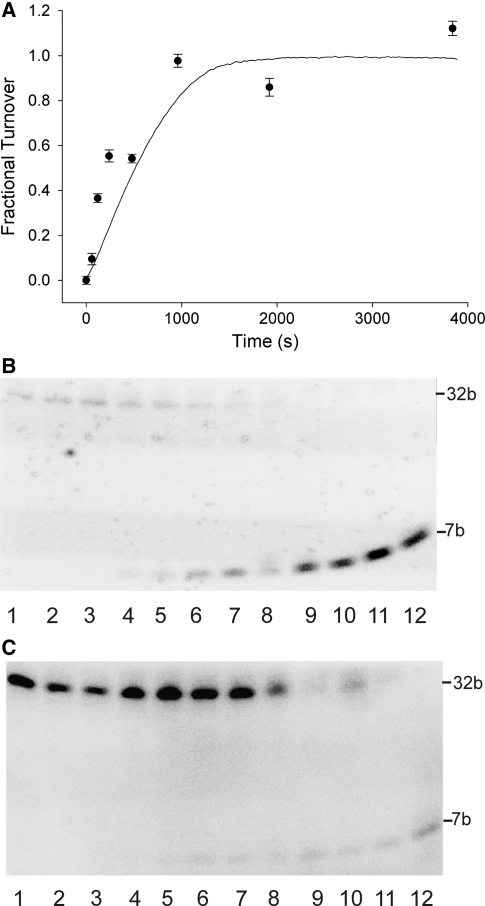
Figure 4.
Analysis of time courses for coupled and stepwise enzymatic reactions. (A) Comparison of time courses of product formation in stepwise (filled circles) and coupled (solid line) assays expressed as fractional turnover. (B) Gel analysis of coupled and stepwise enzymatic reactions. The fluorescence image is of a 20% urea-polyacrylamide gel of stepwise and coupled assays and was recorded before staining. Lanes were as follows: 1, coupled assay negative control (no AdoMet); 2, stepwise assay negative control (no AdoMet) incubated for 0 min; 3, stepwise assay negative control (no AdoMet) incubated for 64 min; 4-11, stepwise assay incubated for 0, 1, 2, 4, 8, 16, 32 and 64 min respectively; 12, coupled assay. (C) As in (B) but after staining with GelRed stain.

