Figure 1.
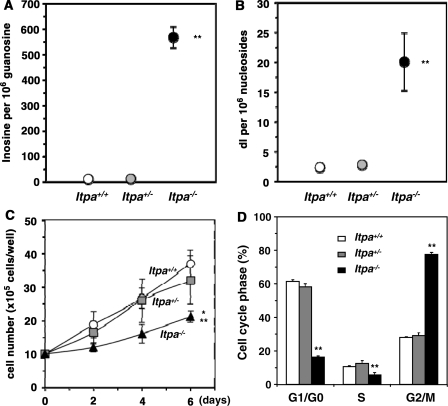
ITPA-deficient primary MEFs exhibit various cellular dysfunctions. (A) ITPA deficiency caused a significantly increased accumulation of inosine in cellular RNA. Inosine level was determined by LC–MS/MS analysis of cellular RNA prepared from embryos (N3). Result of non-repeated measures ANOVA (two-tailed), P = 1.69 × 10⁻⁷. Student–Newman–Keuls (SNK) post hoc test, **P < 0.01 (versus Itpa+/+ and Itpa+/−). Data are shown as the mean ± SD (n = 3 independent embryos). (B) ITPA deficiency caused a significantly increased accumulation of deoxyinosine (dI) in nuclear DNA. Deoxyinosine (dI) level was determined by LC–MS/MS analysis of nuclear DNA prepared from embryos (N3). Result of non-repeated measures ANOVA (two-tailed), P = 0.00038. SNK post hoc test, **P < 0.01 (versus Itpa+/+ and Itpa+/−). Data are shown as the mean ± SD (n = 3 independent embryos). (C) ITPA deficiency impairs normal cell proliferation. Primary MEFs (Passage 2) isolated from four separate Itpa−/– embryos showed significant prolonged doubling time in comparison to those from Itpa+/+ and Itpa+/− embryos. Result of repeated measures ANOVA (two-tailed), P = 0.0005. Bonferroni/Dunn post-hoc test, *P < 0.05 (versus Itpa+/−), **P < 0.01 (versus Itpa+/+). Data are shown as the mean ± SD (n = 4 independent MEFs). (D) ITPA deficiency causes G2/M arrest. Primary MEFs (Passage 5) were subjected to flow cytometry analysis and the percentages of Cell-cycle phases in each MEF set were determined. Result of non-repeated measures ANOVA (two-tailed), P = 1.74 × 10⁻⁸. Bonferroni post hoc test, **P < 0.01 (versus Itpa+/+ and Itpa+/−). Data are shown as the mean ± SD (n = 3 independent isolates).

