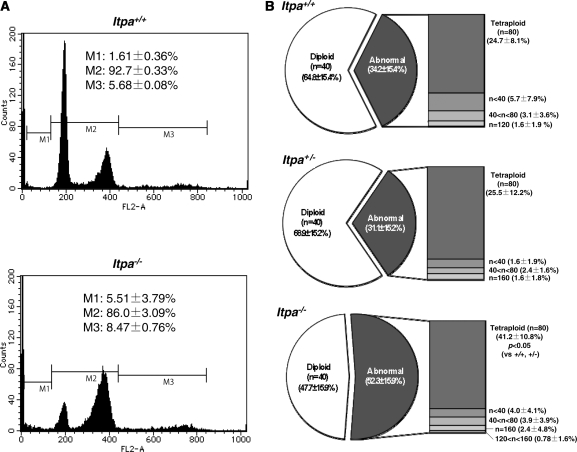
Figure 2.
Increased DNA content in ITPA deficient primary MEFs. (A) Flow cytometric analysis of the cell cycle was performed and the sub G1 fraction (M1), diploid fraction (M2) and a fraction with an increased DNA content (M3) were determined. (B) ITPA deficiency increased chromosomal ploidy in primary MEFs. Percentages of diploid, tetraploid and others are shown in pie charts with the mean ± SD (three independent isolates). The frequency of tetraploidy was increased significantly in Itpa−/– MEFs. Results show non-repeated measures ANOVA (two-tailed): P = 0.094. P-value is shown following a Bonferroni post hoc test.

