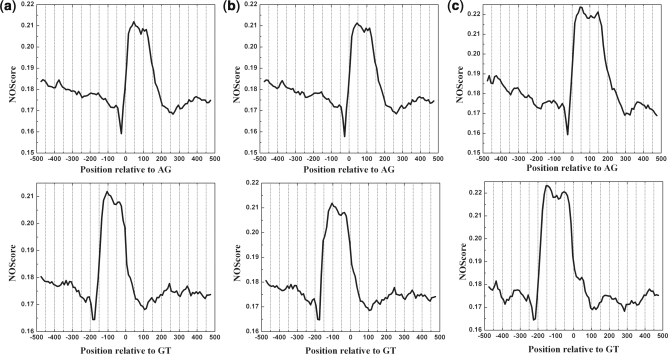
Figure 2.
The nucleosome occupancy score around splice junctions in constitutive splicing event. The score was smoothed with a 50-bp sliding window in 10-bp increments from −500 to 500 bp relative to the splice sites and given for the acceptor (top panel) and donor (down panel) sites, respectively. (a–c) correspond to sequences with exons that ranging from 140 to 160 bp, 160 to 180 bp and 190 to 210 bp, respectively. The x-axis gives the position of the sliding window labeled by its center relative to acceptor site AG (denoted as 0) or to donor site GT (denoted as 0) and the y-axis represents the nucleosome occupancy score.

