Fig. 2.

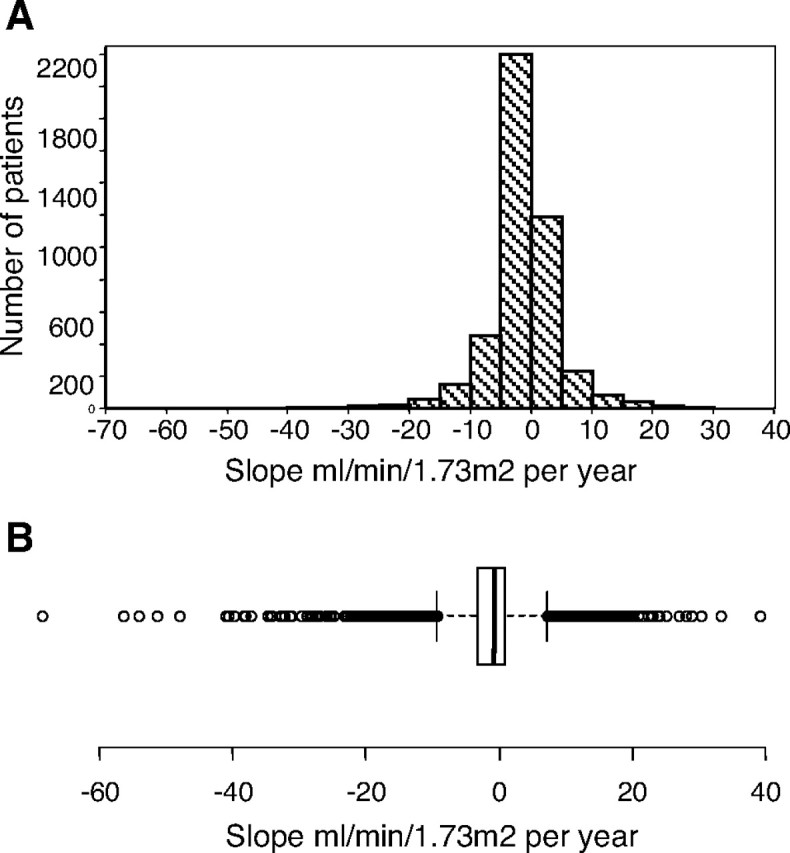
(A) Distribution of GFR slope. (B) The figure illustrates the median of the slopes, the interquartile range and the maximum and minimum values.

(A) Distribution of GFR slope. (B) The figure illustrates the median of the slopes, the interquartile range and the maximum and minimum values.