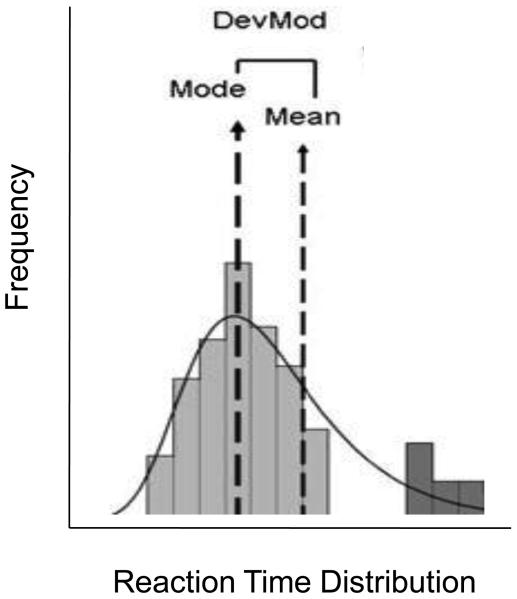
Figure 1.
Schematic of DevMod measuring lapses of attention. This figure shows the separation of the mode and the mean when there are long reaction times or ‘lapses in attention’. It shows that long reaction times change the mean while leaving the mode relatively unaffected. The difference between the mean and the mode provides a measure of the skew, and the deviation from the mode (DevMod) is considered a measure of inattention. Text and figure printed with permission from de Wit (2009).

