Figure 6.
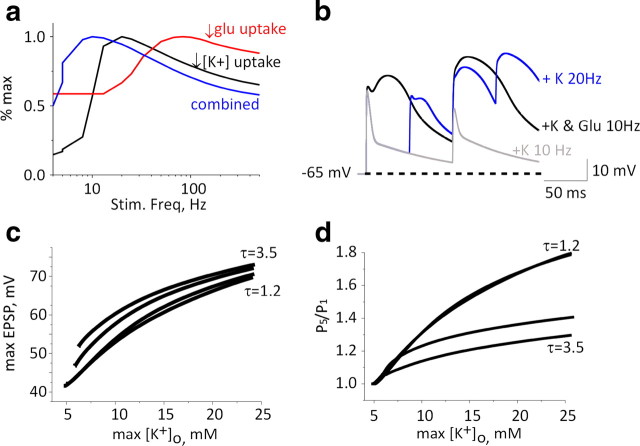
Modeling the concerted effect of reduced potassium and glutamate clearance. a, EPSP facilitation (relative to maximal value) for a 10-fold decrease in [K+]o clearance (black), a twofold slowing of glutamate decay time constant (red), and downregulation of both uptake mechanisms (blue) as a function of stimulation frequency. b, EPSP traces for 10 and 20 Hz trains under a 10-fold decrease in astrocytic K+ clearance (gray and blue traces, respectively) and with both uptake mechanisms downregulated (at 10 Hz, black). The dashed line marks the resting potential. c, Maximal EPSP amplitude elicited by a train of five stimuli as a function of maximal [K+]o for different glutamate uptake decay time constants (for 1.2, 2.2, 3.2, and 3.5 ms). d, EPSP facilitation [ratio of fifth to first EPSP amplitude (P5/P1)] for 20 Hz stimulation for different glutamate decay time constants (as in c).

