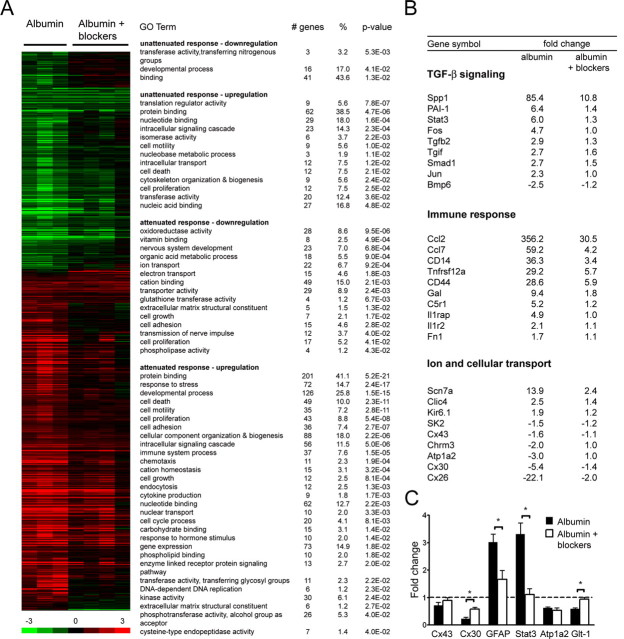
Figure 6.
Blocking TGF-β signaling prevents albumin-induced gene expression. A, Genomic expression analysis after treatment with albumin or albumin plus TGF-β receptor blockers. SAM was performed with an FDR threshold of 9.2%, and these genes are represented on the heat map. Gene ontology analysis was performed with DAVID for genes showing an attenuated [(albumin log2ratio) − (albumin + blocker log2ratio) > 0.5] or unattenuated response after treatment with albumin plus TGF-β receptor blockers compared with albumin treatment (see Materials and Methods). B, Fold changes for specific genes from GO analysis. C, qPCR analysis for selected genes after albumin (n = 3) or albumin plus TGF-β receptor blockers (n = 4). Error bars indicate SEM, and asterisks indicate p < 0.05.

