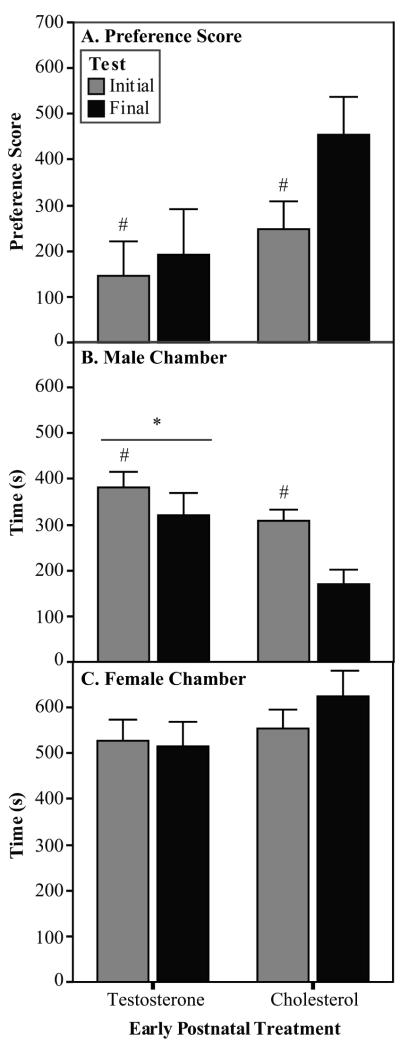
Fig. 2.
Partner preference data (Experiment 2). In Experiment 2, the experimental males were exposed to early postnatal treatments and stimulus males were treated with ATD. A) The C males showed a trend for a higher preference score than did the TP males in the partner preference tests. Preference score is calculated as time spent with stimulus female minus the time spent with stimulus male. B) The TP males spent more time in the stimulus male chamber than did the C males. C) The amount of time spent with the stimulus female was not affected by early postnatal treatment. TP n=17, C n=16 *Significantly different from C males. #Significantly different from Final test.

