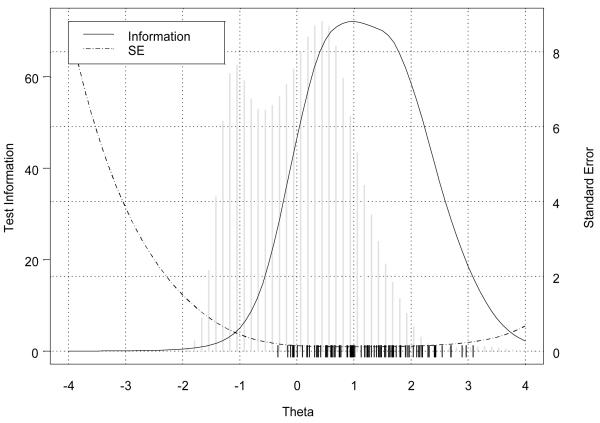
Figure 2. Information function and trait distribution for the Stigma Scale for Chronic Illness items.
Note: The information function and standard error are shown as lines within the plot. The distribution of individual trait scores are depicted as a histogram. The hash marks are locations of the category threshold parameters that indicate that the test provides good measurement at moderate to severe levels of stigma.

