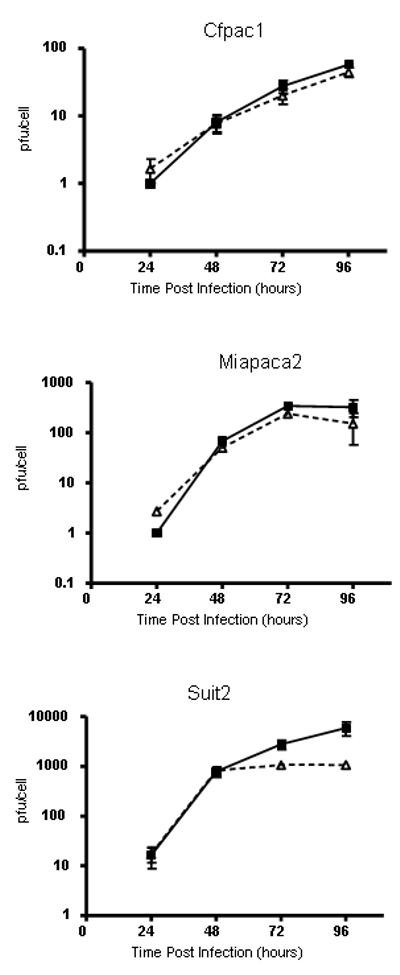
Figure 3.

Viral replication of VVLister in normoxia (solid line) and hypoxia (dashed line) measured by TCID50 assay of viral burst assays. Cell lines were exposed to normoxia or hypoxia prior to and post infection with an MOI=1 of VVLister. Burst assay samples were collected at 24, 48, 72 and 96 hours post infection. TCID50 assays were performed on CV1 green monkey kidney cells. Experiments were performed in triplicate for each cell line, time point and condition. Results are presented as mean +/− standard deviation.
