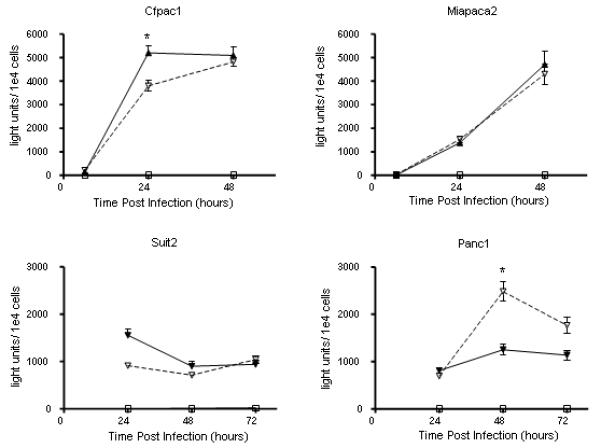
Figure 5.

The effect of hypoxia on transgene expression from VVL15. Cells were infected with 1pfu/cell of VVL15 and luciferase activity measured at the time points indicated. All experiments were performed in triplicate and results represent the data from three separate experiments. Results are presented as mean +/− s.d. (Solid line & triangle = 20% pO2, Dashed line & triangle = 1% pO2, Solid line and square & mock infection. Light units = photons/second/cm2. * = P<0.05).
