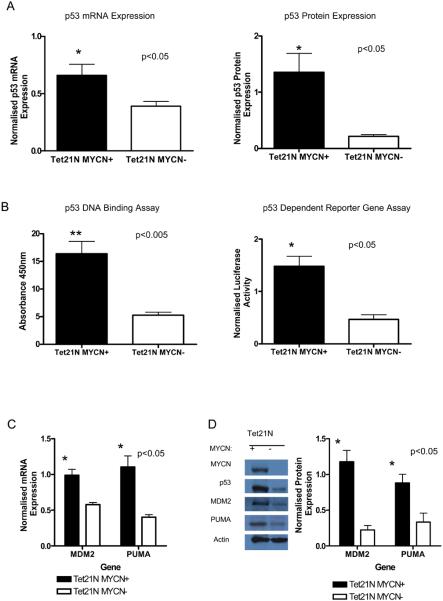
Figure 3. p53 mRNA and protein expression, and DNA binding and transcriptional activity in Tet21N cells.
A) p53 (Left) mRNA and (Right) protein expression in the presence of MYCN, (paired t-test, p<0.05). B) (Left) p53 DNA binding capacity (paired t-test, p<0.005) and (Right) p53-dependent reporter gene activity (paired t-test, p<0.05) in the presence of MYCN. The luciferase activity of the p53-dependent pGL3-P2 reporter construct was normalized to β-galactosidase activity of pCMV-β-galactosidase plasmid construct. C) Bar chart showing higher mRNA expression of p53 target genes MDM2 and PUMA in the presence of MYCN (paired t-test, p<0.05). D) (Left) Western blot and (Right) densitometry analysis normalized to actin showing higher protein expression of p53 target genes MDM2 and PUMA in the presence of MYCN (paired t-test, p<0.05).

