
Figure 5.
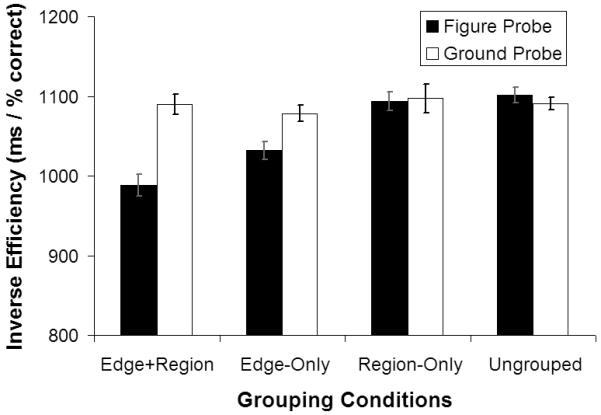
Experiment 3 Results. Average Inverse Efficiency (IE, corresponding to mean correct reaction time divided by proportion correct responses) is plotted as a function of edge-grouping, region-color-similarity, and probe type. Error bars represent 95% within-subjects confidence intervals. Note the enhanced efficiency of performance for figure compared to group probes, when edges were grouped (second pair of bars from left), and even more so when edges were grouped and regional colors were matched (leftmost pair of bars).