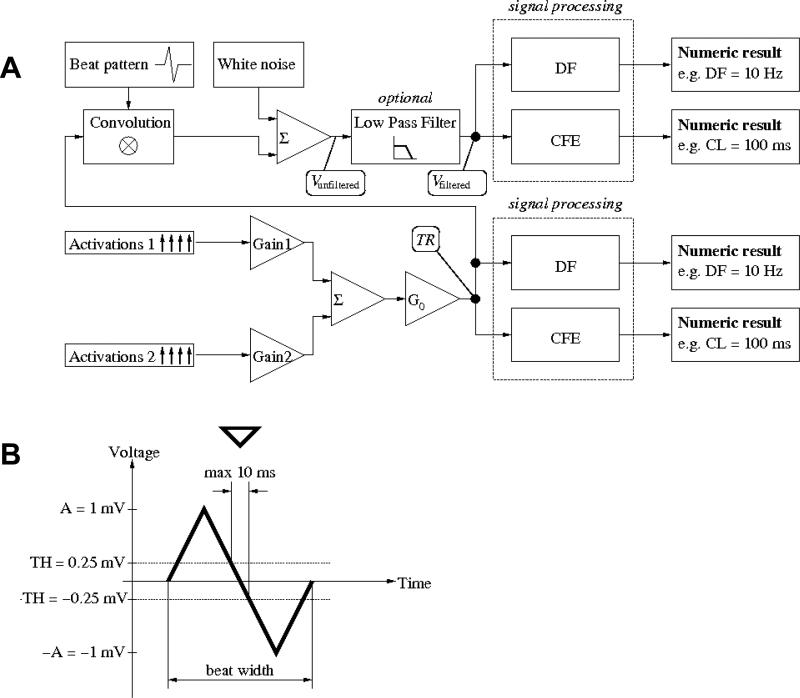
Fig. 2.
A. Comparison environment. Two activations series (1 and 2), each generated as in Fig. 1 with different parameters are multiplied by constant weights (gains G1,G2) and added together; the sum is multiplied by a random master gain G0. The signal is then processed by the DF or CFE methods to provide numeric results in Hz or ms, respectively. B. Individual beat pattern used in actual simulation (13.3 ms width; please note that, formally, pattern h is dimensionless with an amplitude of 1. The amplitude of 1 mV in the figure results from A = 1mV and unitary gain G0 = 1). Detection criteria: crossing from above positive threshold (TH = 0.25 mV in this example) to below negative threshold (–TH = –0.25 mV in this example) within less than 10 ms. Down pointing triangle indicates the activation time detected.

