Fig. 3.
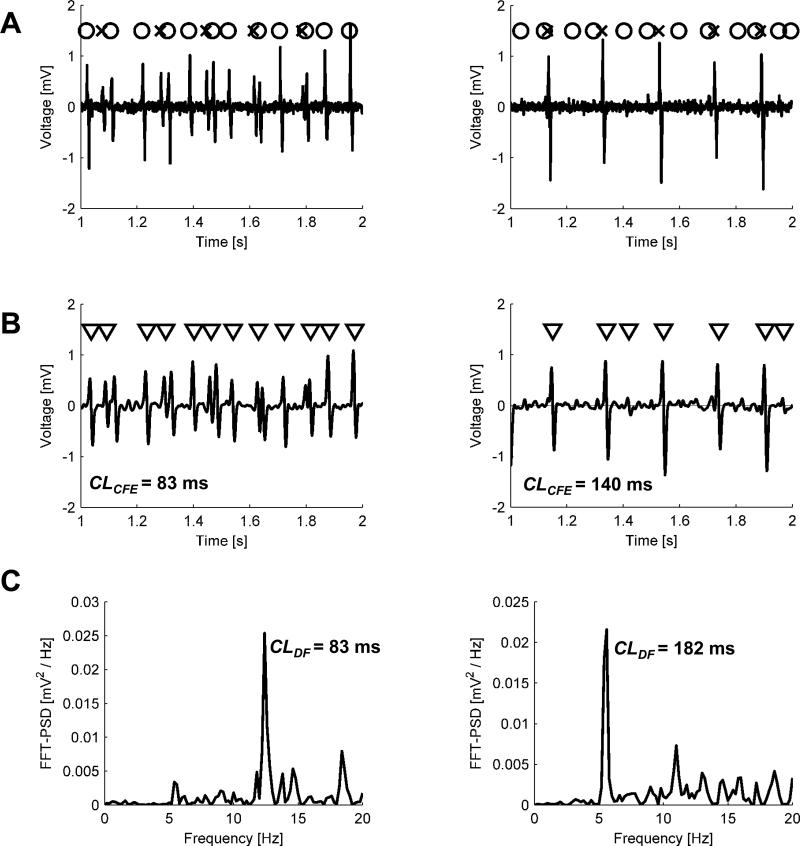
Two examples of generated signals: CFAE-positive (G80 ms = 1–G180 ms = 0.6) on the left and CFAE-negative (G80 ms = 1 – G180 ms = 0.05) on the right. A. Unfiltered electrogram (solid line), generated from two series of activation times, each similar to that shown in the last row in Fig. 1 (activations resulting from BCL = 80 ms are marked with circles and activations from BCL = 180 ms with crosses), by convoluting train TR with a beat pattern h. B. Low pass (20 Hz cut-off frequency) filtered (solid line) and activation times detected in it using CFE method The length of observation divided over the number of detected activations yields mean CFE, an estimated cycle length. In the right plot, the third and the last triangle indicates unwanted detections, which in turn artificially shorten CL estimate. Although overall filter gain was adjusted to preserve the beat amplitude, some beats could lose or gain more than the others (for instance, the first beat is larger than the third one in A but not in B). C. Power spectral density of electrogram shown in B, calculated in DF method. The frequency of the highest peak (about 12 or 5.5 Hz, respectively) was denoted as DF.

