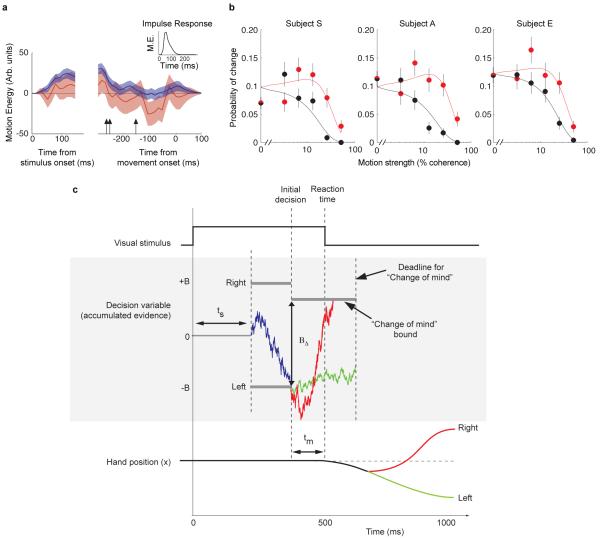
Figure 3.
A bounded accumulation model of decision making with post-initiation processing explains change of mind. a, Influence of motion energy fluctuations on initial and final decisions. Data are shown for all the trials (blue) and the subset of trials with a change of mind (red) aligned at stimulus onset (left) and movement onset (right). Motion energy fluctuations were obtained by applying a filter to the sequence of random dots shown on each trial and subtracting off the mean for all trials sharing the same motion strength and direction (see Methods). The residual fluctuations are designated positive if they support the direction of the initial decision. Shading indicates s.e.m. Arrows indicate the time preceding movement initiation that the average motion energy fluctuations for each subject falls to within 1 s.e. of zero. The inset shows the impulse response for the filter used to calculate motion energy. b, The model explains the probability of changes of mind from incorrect to correct choices (model, red curves; data red symbols) and changes of mind from correct to incorrect choices (black curves; black symbols) as a function of stimulus coherence. Error bars are s.e.m. c, Information flow diagram showing visual stimulus and neural events leading to a decision and a possible change of mind. The example illustrates a rightward motion stimulus which gives rise to an initial incorrect leftward choice with reaction time around 500 ms. The visual stimulus gives rise to a decision variable (blue trace) that is the accumulation of noisy evidence. This governs the initial choice and decision time. Data from neural recordings15,16 suggest that the delay from motion onset to the beginning of this accumulation (ts) is around 200 ms. The initial decision is complete when a ‘Right’ or ‘Left’ bound is crossed (i.e., ±B of evidence has accumulated). The example shows an initial decision for left. The time of the termination is around the mean decision time for the three subjects. Further accumulation takes place on the evidence still in the processing pipeline and if the accumulated evidence reaches the opposite “change of mind” bound then the decision is reversed (red), otherwise it is confirmed if the deadline is reached (green).

