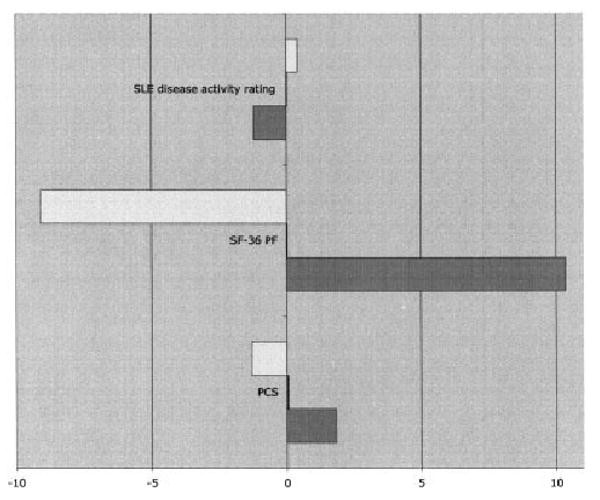
Figure 1.

Responsiveness of valued life activity (VLA) disability scores. Values to the left of the 0 point on the graph represent scores that decreased from baseline to followup on the systemic lupus erythematosus (SLE) disease activity rating, the Short Form 36 (SF-36) health survey's Physical Function (PF) subscale, and the SF-36 Physical Component Summary (PCS) subscale; values to the right represent scores that increased. Open bars represent the scores on these scales for individuals whose VLA disability worsened, solid bars (which are barely visible) represent the scores for individuals whose VLA disability did not change, and shaded bars represent the scores for individuals whose VLA disability improved.
