
Figure 2.
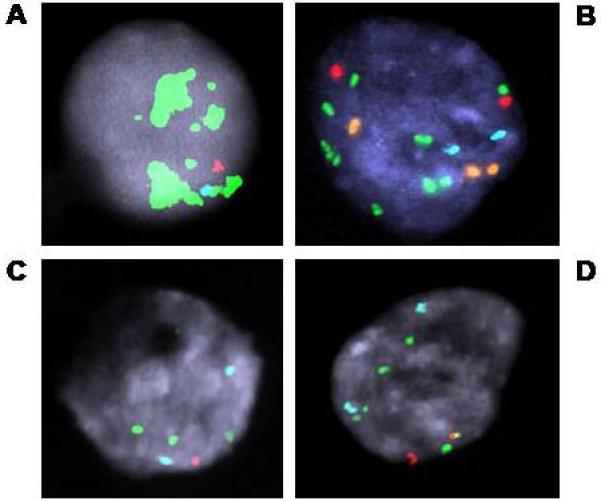
MYC abnormalities seen in CTC. A. MYC amplification. B. Aneuploidy, probably polyploidy, with relative gain of MYC. C&D. Loss of 8p with gain of MYC and corresponding polyploid version from the same sample. Probes used for A, C, & D: MYC (green), 8 centromere (aqua) and 8p (LPL, red)(ProVysion); and for B: AR (orange), X centromere (aqua), MYC (green) and 8p (NAT2, red).