
Figure 3.
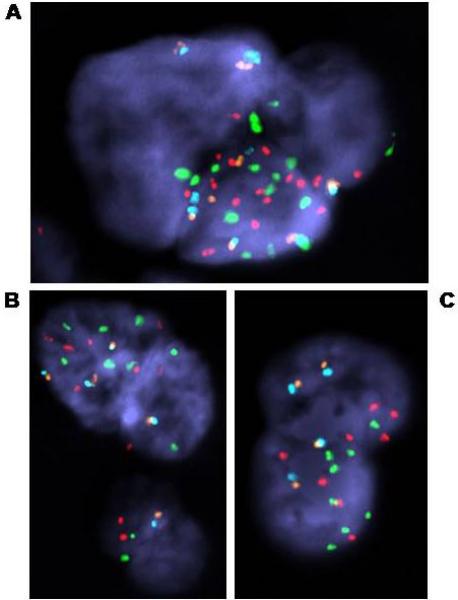
FISH analysis of CTC and atypical cells.
A. Apparent megakaryocyte with 16n probe copy number. Note the clustering of signals in one area, indicating that the whole cluster represents a single convoluted nucleus.
B. Possible CTC cluster (microembolus of 4 cells with normal signal pattern) or megakaryocyte derivative (8n copy number), plus normal leukocyte from same sample as A. CTC from this sample showed a probable Xq isochromosome as the sole abnormality detected. Probes used: AR (orange), X centromere (aqua), MYC (red) and chromosome 8 centromere (green). C. Convoluted nucleus with 8n probe copy number, origin uncertain. Probes used: AR (orange), X centromere (aqua), MYC (green) and 8p (NAT2, red).