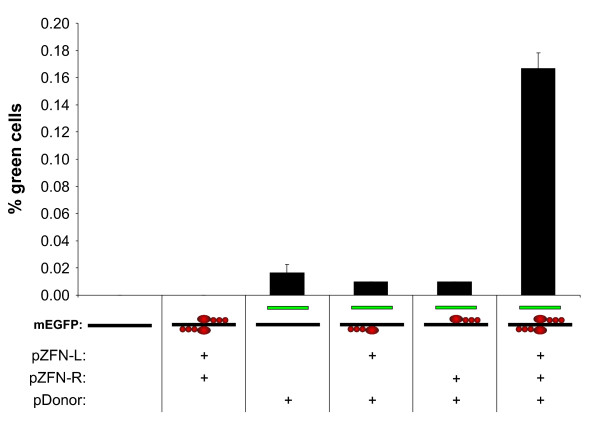
Figure 2.
Stimulation of targeted gene correction by ZFNs. 293-Flp-mEGFP cells with a single genomic copy of the mEGFP target (black line) were transfected with the pDonor (green line) and ZFN constructs (four red circles) as indicated below the bars. Gene correction as a result of HR between the genomic mEGFP target and the ΔEGFP in the pDonor was measured 72 hours after transfection by flow cytometric quantification of green cells. For each flow cytometric analysis at least 100 000 cells were measured. Each bar represents mean ± SD from three parallels.

