Figure 5.
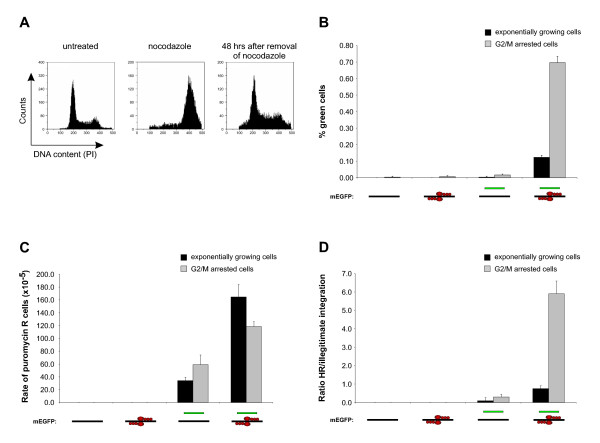
Effects of G2/M arrest of the target cells on gene correction and illegitimate integration. (A) Cell cycle profiles of exponentially growing, nocodazole arrested, and nocodazole arrested and subsequently released 293-Flp-mEGFP cells (left, middle and right panels, respectively). Histograms displaying the distribution of the DNA content of treated cells as measured by propidium iodide (PI) staining are shown. (B) Quantification of gene correction in exponentially growing (black bars) and G2/M arrested (gray bars) 293-Flp-mEGFP cells after transfection with pDonor, pZFN-L and pZFN-R as indicated. The amount of green cells was measured 72 hours after transfection by flow cytometry as in Fig. 2. (C) Quantification of illegitimate integration in exponentially growing (black bars) and G2/M arrested cells (grey bars). Cells were treated as in B and the level of illegitimate integration was quantified by measuring the number of puromycin resistant colonies formed as in Fig. 3B. The results presented are normalized for different PE in the untreated and G2/M arrested cells. (D) Presentation of the ratio between HR and illegitimate integration in exponentially growing (black bars) and G2/M arrested cells (grey bars). The ratio was calculated from the results in B and C.

