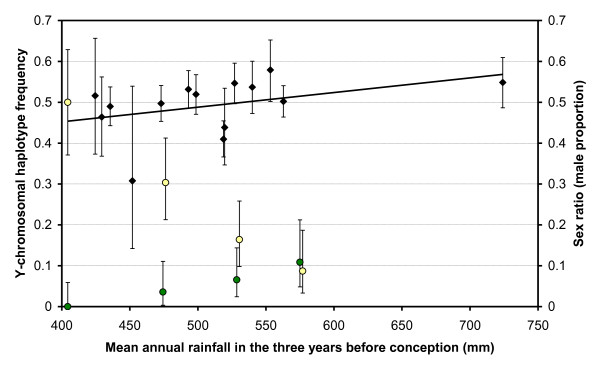
Figure 4.
Correlations of annual foetal sex ratio and Y-chromosomal haplotype frequencies per year cohort with rainfall. Black diamonds: sex ratio, Green circles: haplotype 112, Yellow circles: haplotype 557, Error bars: 90% CI. Y-chromosomal haplotype frequencies: weighted average across several years for both haplotype frequencies and annual rainfall. Annual foetal sex ratios: years running from Nov. till Oct. (starting at wet season; Pspearman = 0.041, R2 = 0.15, linear relationship). Haplotype 112 was not observed when mean rainfall < 450 mm (n = 38). Here the error bar represents the frequencies for which the chance of not sampling haplotype 112 is larger than 10%. Three-year rainfall periods running from Sept. till Aug. in the case of Y-chromosomal haplotype frequencies [29]. Three-year rainfall periods running from Apr. till Mar. in the case of foetal sex ratios (in the latter case including the wet season of the focal year).

